US household data validates Freedom Dividend impact for everyday Americans
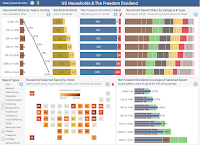
The Freedom Dividend, 2020 presidential candidate Andrew Yang’s proposal for a $1,000 per month universal basic income (aka UBI) for every adult citizen, could cover 97% or more of average food and housing spending for 59% of US households.
I think a lot of relatively well-off people (myself included) don’t have a real sense of how meaningful a reliable $1,000 a month would be to the majority of Americans. I also think we tend to knee-jerk dismiss anything with new taxes attached.
But I’m a data guy. I knew our government has detailed, publicly available data on how households with different incomes spend their money. And I saw an opportunity to objectively demonstrate the Freedom Dividend’s potential for real families, so that people could see the impact to others as well as themselves.
Got the essentials covered but stretched to make auto or medical payments? Freedom Dividend benefits exceed average total spending in transportation and healthcare combined for 92% of US households. And both of those figures are after subtracting Yang's proposed 10% value added tax (VAT) and welfare income.
These insights and more come from the interactive data visualization below, which I built with the 2018 demographic and spending microdata of over 19,000 real American households. The data is public and gathered annually for the Consumer Expenditure Surveys conducted by the US Bureau of Labor Statistics. There’s a lot here; you can scroll with your phone, but it's easier to explore on a tablet or computer.
Examples of other insights you can find exploring this dashboard:
- Higher income adults will pay more of their dividend back as VAT (those in the highest income households pay 210% more than the lowest)
- The basic need to pay for food and housing is a much greater burden on low income households (56% of total spending for lowest vs. 41% for highest)
- Higher income households put a far greater share (not just total dollars) of their spending into insurance & retirement (17%, vs. 3% for lowest)
- 100% coverage of basic needs in election battleground states Michigan, North Carolina, Arizona, and Florida (ranging from 61-80%) is even better than the national average (47%)
I think a lot of relatively well-off people (myself included) don’t have a real sense of how meaningful a reliable $1,000 a month would be to the majority of Americans. I also think we tend to knee-jerk dismiss anything with new taxes attached.
But I’m a data guy. I knew our government has detailed, publicly available data on how households with different incomes spend their money. And I saw an opportunity to objectively demonstrate the Freedom Dividend’s potential for real families, so that people could see the impact to others as well as themselves.
